Portfolio · Compliance and Risk
Supervisory Early-Warning Dashboard
A concept dashboard that ranks banks, microfinance firms and SACCOs by risk, explains each score from its indicators, and keeps an audit trail of every alert decision.
- Discipline
- Supervision · Risk ranking
- Status
- Concept demo. Not a client project. Runs on synthetic data only.
Request access to open it. All institutions in the demo are fictional.
The problem it solves
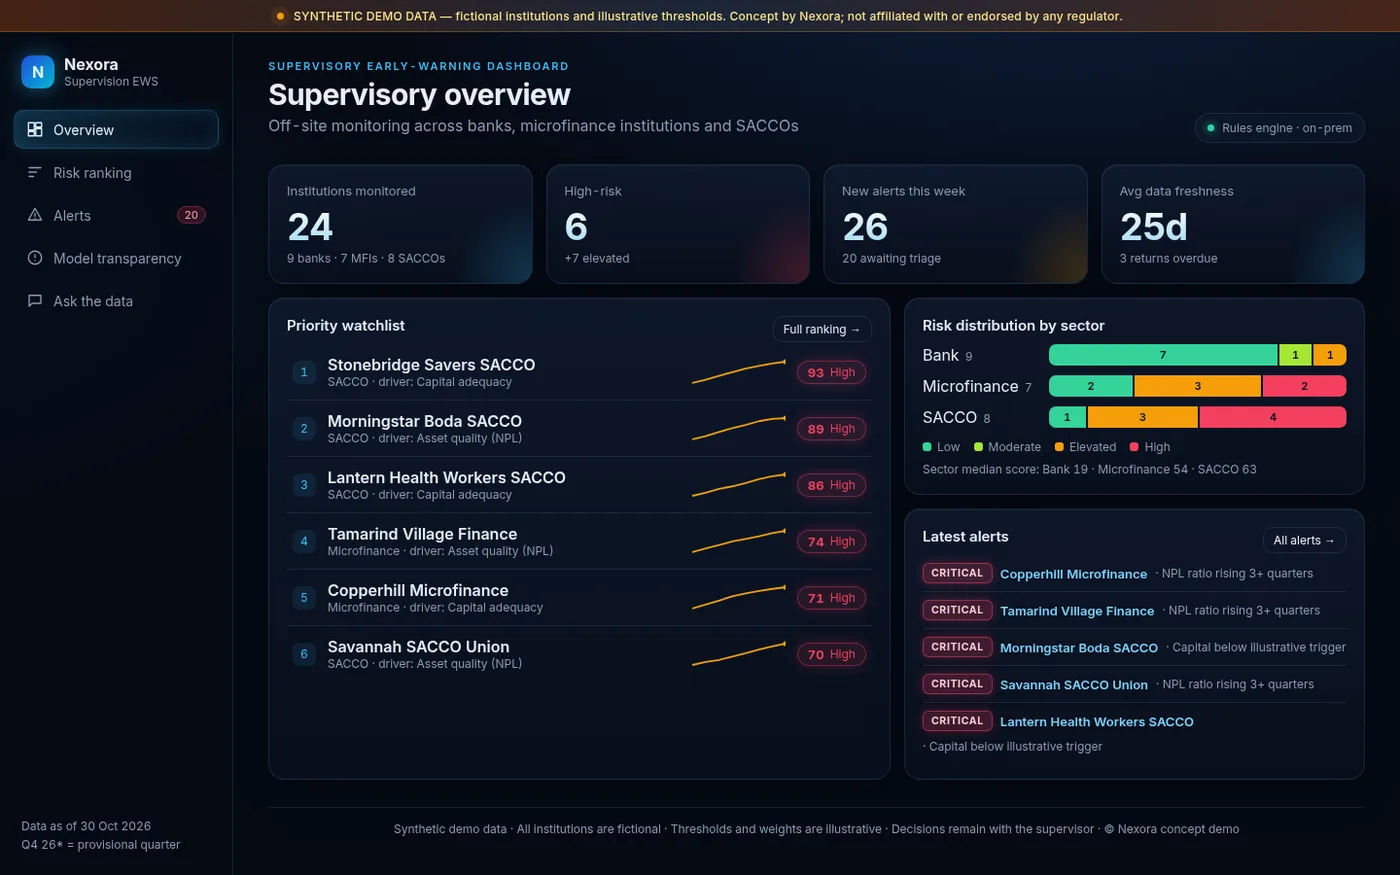
A supervisor watching many institutions needs to see early which ones are deteriorating and why. This concept puts the indicators, the ranking and the alerts in one place, with scores that can be traced back to their inputs.
How it works
01
Indicators for each institution, such as NPLs, capital, liquidity, losses and overdue returns, are loaded per quarter.
02
Transparent rules turn each indicator into a risk value and combine them into a composite score.
03
Institutions are ranked and grouped into risk bands by sector, and alerts are raised.
04
A reviewer opens an institution to see the score contribution of each indicator and eight quarters of trends.
05
Alert status changes are logged, and suggested examiner actions are shown for human review.
Key features
Ranked risk view
Sort and filter institutions by score, sector and risk band.
Explainable scores
Each score is broken down by indicator: contribution equals weight times indicator risk. No black box.
Alerts with audit trail
Every alert status change is recorded. In the demo the log is kept in the browser session only.
Ask the data
Type simple questions about NPLs, capital, liquidity or top risk. In the demo the answers come from fixed queries, not a language model.
Who it is for
Designed as a concept for financial supervisors overseeing banks, microfinance firms and SACCOs.
What the demo shows
- A supervisory overview, a ranking table and an institution detail page with indicator trends.
- Suggested examiner actions, marked as suggestions only. The decision stays with the supervisor.
What is real and what is example
Real
- The ranking, score breakdown, filters, alert workflow and audit log work in the demo.
Example
- All institutions are fictional and the data is synthetic.
- All weights and thresholds are illustrative, not official regulatory thresholds. A real deployment would calibrate them with the supervisor.
- Not affiliated with or endorsed by any regulator.
Screens from the demo
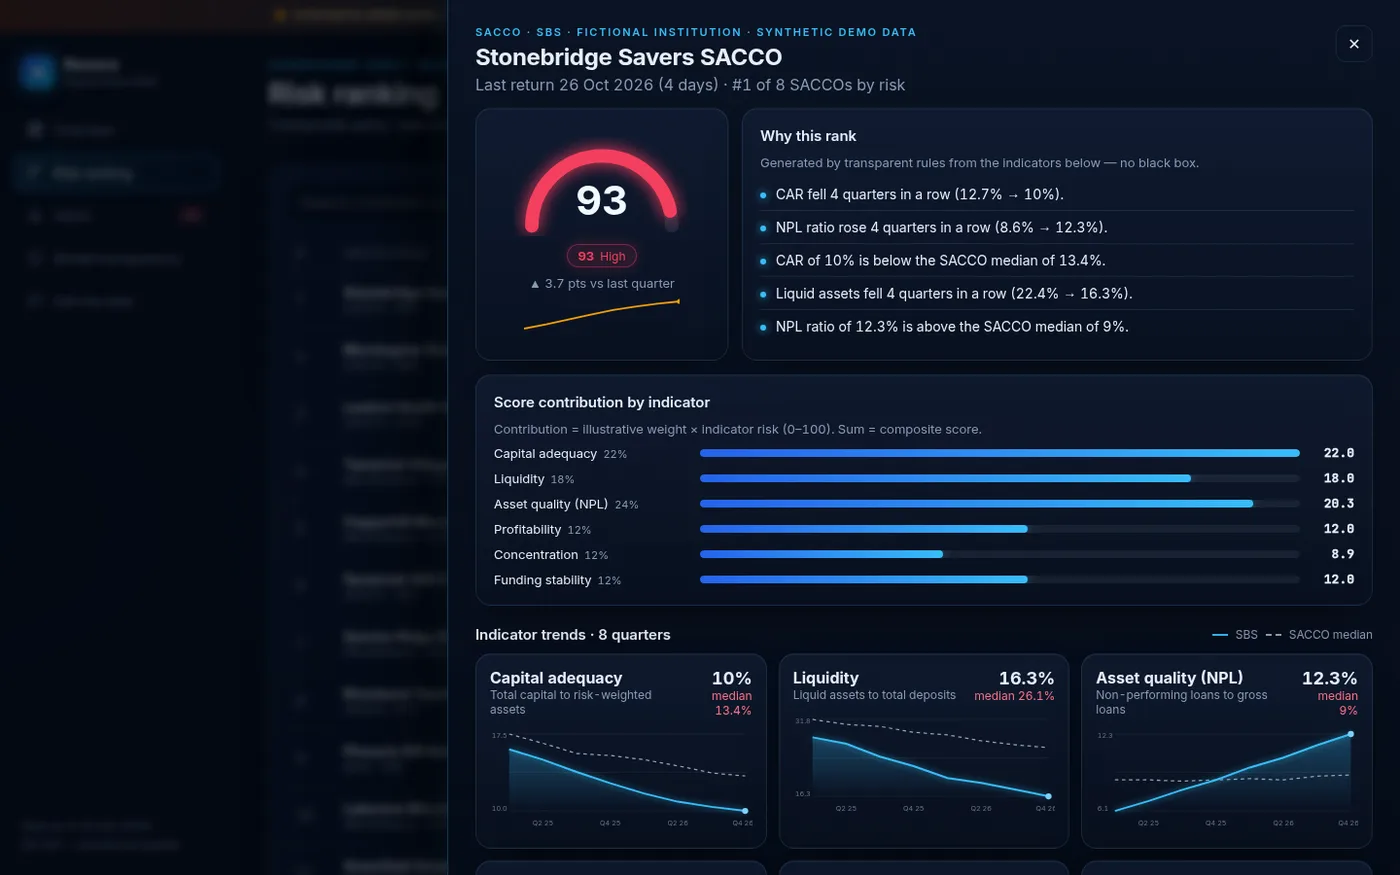
All institutions and figures in these screens are fictional.